Monitoring & Graphing Tool in Mikrotik
Routers that have completed our setting and already running, it does not mean we will abandon. The first router is a backbone router. In most ISPs will even monitor for 24 hours nonstop to ensure the good condition of the router - either alone. And if anything happens that makes the network router does not run properly, can be addressed properly.
Likewise network admins also need to record the bandwidth usage for the
material in the report whether the bandwidth to get the appropriate
information from the ISP bandwidth services, or simply recorded by the
client bandwidth usage statistics. To keep records in graph format in MikroTik, network admins can use the "Graphing".
Tool Graphs
First, we will discuss the features of the first graph, this feature
can be accessed via the menu Tools -> Graphing, or via the terminal
with the command / tool graphing
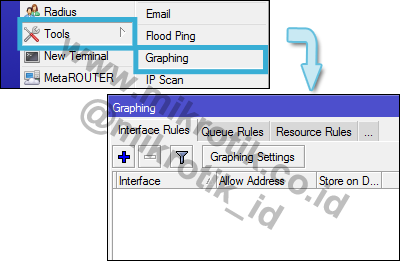
With tools graph, we can do the monitoring of some parameters on the router and presenting it in graphical form. This graph can be seen by the access router via the web, the address format http:// [router ip] / graphs. For example 192.168.128.105/graphs
By default, the graph tool is not recording any data, when viewed via a web browser have not found any data. It takes any parameter settings to be recorded as well as additional policy if needed. We try to monitor the amount of traffic on one interface, eg for ether2 interface. First, set the settings on the first graphing / graphing tools. Setting this graph to determine how to record the data every minute. Then, add the interfaces to be monitored on the tab "interface rule". In this tab please add ether2 interface.
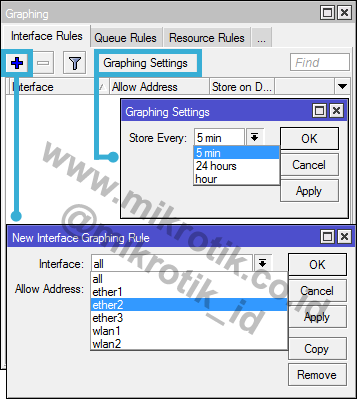
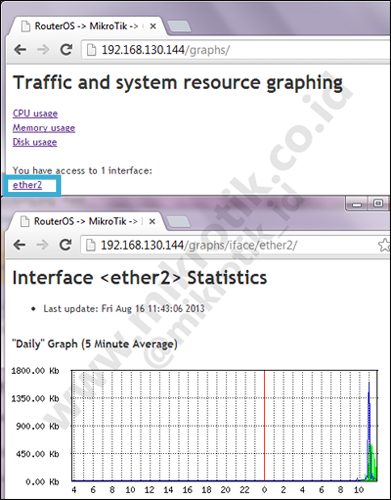
In addition to a router interface, the graph can also record Resource
hardware such as CPU, memory and RAM, or it could be to record Queue. If you are familiar with tools or other applications for network monitoring, display graph it can be said to be almost similar.
The Dude Speaking of applications for network monitoring, Mikrotik has a tool that can display the network in the form of a folder. The tool is The Dude, and as usual MikroTik always provide a free application solutions as well as The Dude's palikasi. Can be downloaded for free directly from http://MikroTik.com
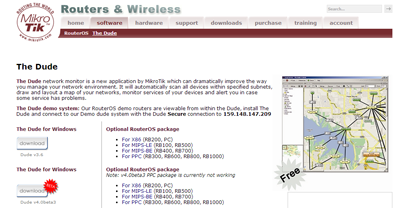
The Dude can be installed on RouterOS (the file format. Npk) or can be
installed The Dude version of Windows on the PC executable format file
(. Exe).
Once we run the application Dude on a Windows PC, Dude we can use to
scan and display the network topology in the form or folder. So that will facilitate the monitoring and network management.
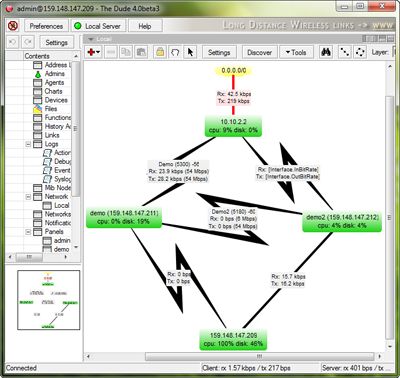
Implementations are typically used, The Dude installed on the router,
so the network folder will be stored in it, then to access the folder on
the router, we need to install The Dude on the PC with the same
version. In addition to monitoring the network, we can also do management / remote to the router directly by The Dude. For example, ping, traceroute, bandwidth test is performed directly from our remote router.
The Dude will give you a warning, usually a color change to red when the device is down.
And one plus the value of The Dude, this application can not only be
used for monitoring any Mikrotik device, as long as a device to enable
SNMP, then The Dude can be used for monitoring and management.
SNMP
Then we try needs now reversed, can Mikrotik Router in the monitoring and management with a tool other than The Dude?. And it turns out Mikrotik can be monitored using other applications, for SNMP in Mikrotik active.
Simple Network Management Protocol (SNMP) is the Internet standard protocol for managing devices on a network. SNMP can be used for a variety of graph data. Examples of its use in applications like The Dude and Mikrotik order can be managed, then the SNMP must be enabled. Quite easy, enable SNMP pd Mikrotik, can with command: / snmp set enabled = yes
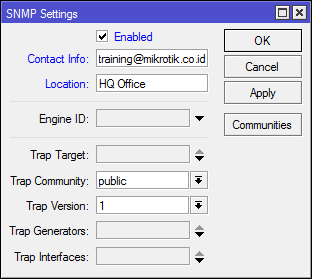
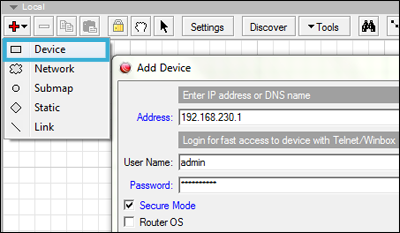
After setting the SNMP in Mikrotik, live sets in applications that will perform the monitoring and management of the router. If using The Dude, can be a way "Add Device". On the contents of the address with the IP address of the router. Do not forget to check the Secure Mode option.
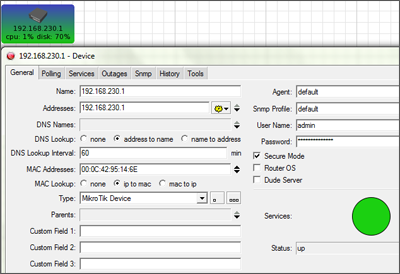
If it is added, then double-click the device and make sure the status is up. If it is not up or does not show up status information, go to the Services tab, then click the "Discover".
For monitoring traffic running on the router, connect the device to the network by adding a link. Then double-click on the link.
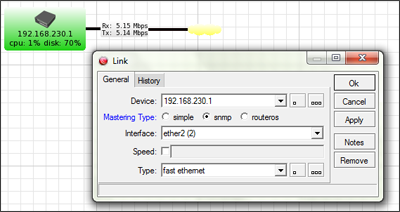
Mastering Type please select SNMP. Then select the traffic on which interface is monitored. It will appear in real time bandwidth information. So, there are many ways to perform network monitoring and management. The Dude is a solution that is reliable and free.
No comments:
Post a Comment